
Apps reload when you switch back to them. The screen hesitates. The phone gets warm. It is tempting to blame RAM and start closing everything, but memory is only one part of the story.
Why performance feels uneven
A slow moment can come from a busy processor, memory pressure, heat, low storage or one demanding app. Without a few readings, it is easy to fix the wrong thing — clearing caches that were fine or closing apps that were not the problem.
See what the phone reports
Device Matrix shows the memory and performance information Android exposes. You can look at total and available RAM, swap details where reported, processor cores and supported CPU readings, storage and battery temperature. If a value is not available, the app says so instead of guessing.
Thermal readings are useful when the phone feels hot or starts slowing down during a game, a video call or charging. You may see thermal headroom, status and battery temperature where the device provides them. Warmth is normal; the reading is context, not a diagnosis.
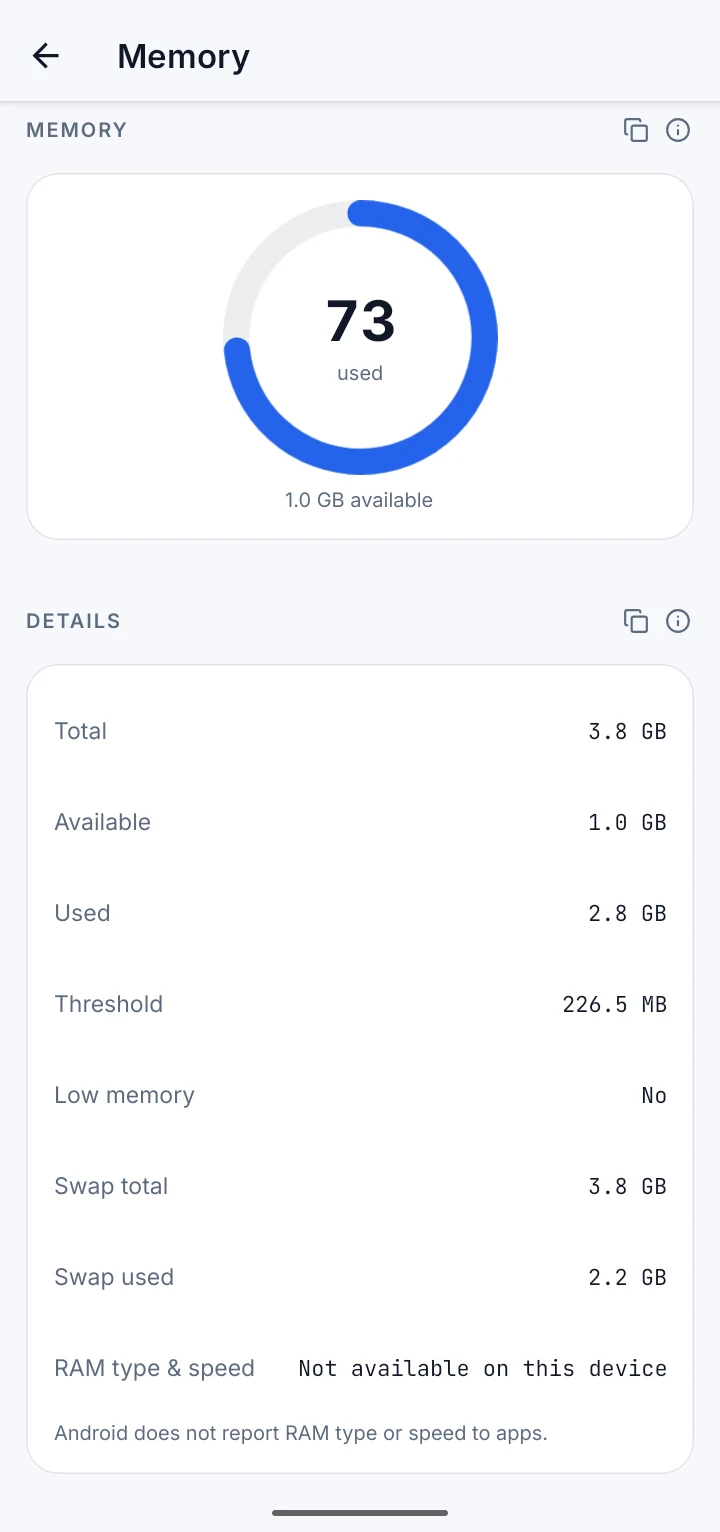
Memory
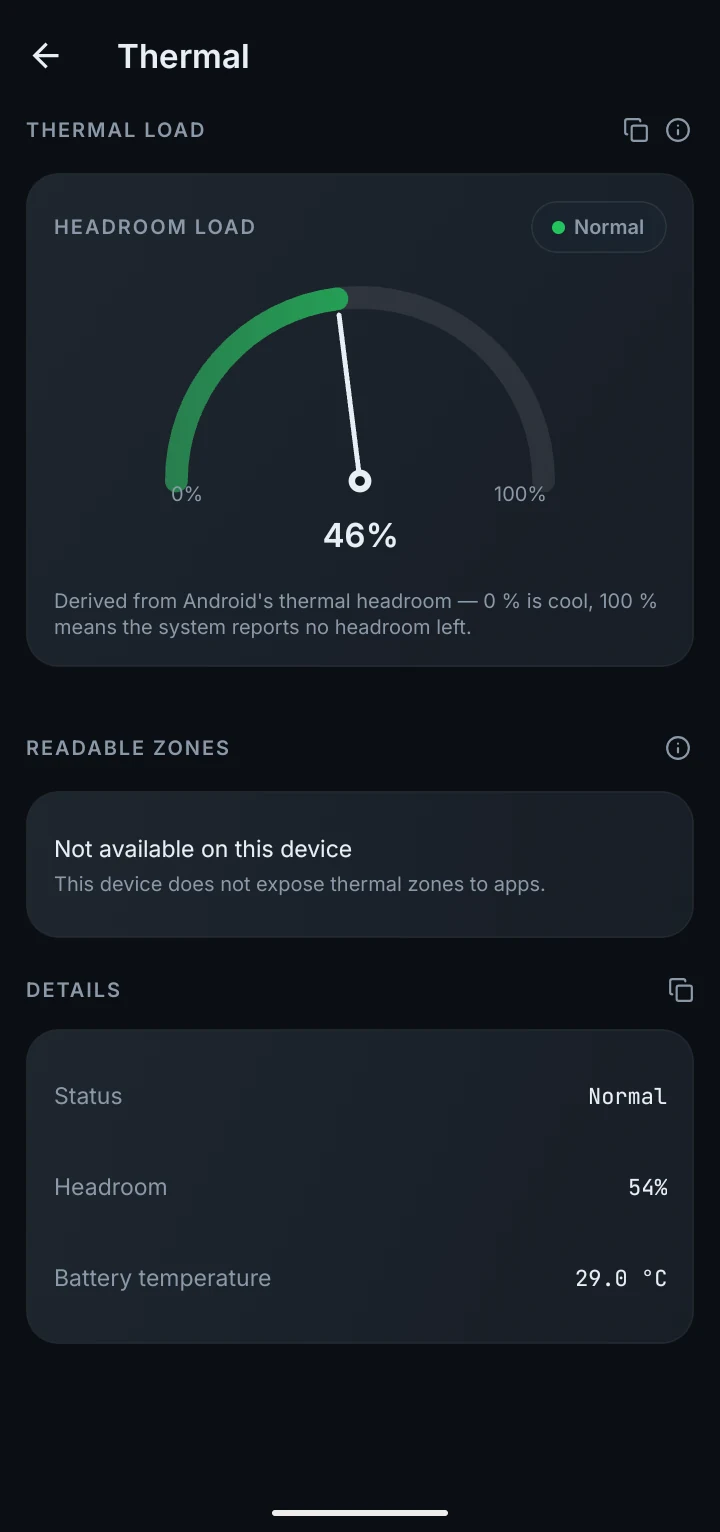
Thermal
Supported home-screen widgets can keep RAM, storage and battery readings within reach. Widgets are added through your launcher, and available sizes and data vary by device and app edition.
What you can explore
Memory at a glance
See used and available RAM, plus swap and low-memory details where Android reports them.
CPU context
Explore processor cores, clusters and supported frequency readings.
Thermal context
Check thermal headroom, status and battery temperature where your phone exposes them.
Widgets within reach
Add a supported widget through your launcher for quick RAM, storage or battery readings.
Take a reading before and after a slow moment. Comparing two readings tells you more than a single snapshot taken at random.